The documentation you are viewing is for Dapr v1.4 which is an older version of Dapr. For up-to-date documentation, see the latest version.
操作方法:在 Kubernetes 中搭建 Fluentd、Elastic search 和 Kibana
先决条件
安装 Elasticsearch 和 Kibana
-
Create a Kubernetes namespace for monitoring tools
kubectl create namespace dapr-monitoring -
Add the helm repo for Elastic Search
helm repo add elastic https://helm.elastic.co helm repo update -
使用 Helm 安装 Elastic Search
By default, the chart creates 3 replicas which must be on different nodes. If your cluster has fewer than 3 nodes, specify a smaller number of replicas. For example, this sets the number of replicas to 1:
helm install elasticsearch elastic/elasticsearch -n dapr-monitoring --set replicas=1否则:
helm install elasticsearch elastic/elasticsearch -n dapr-monitoringIf you are using minikube or simply want to disable persistent volumes for development purposes, you can do so by using the following command:
helm install elasticsearch elastic/elasticsearch -n dapr-monitoring --set persistence.enabled=false,replicas=1 -
安装 Kibana
helm install kibana elastic/kibana -n dapr-monitoring -
Ensure that Elastic Search and Kibana are running in your Kubernetes cluster
$ kubectl get pods -n dapr-monitoring
NAME                            READY   STATUS    RESTARTS   AGE
elasticsearch-master-0          1/1     Running   0          6m58s
kibana-kibana-95bc54b89-zqdrk   1/1     Running   0          4m21s
安装 Fluentd
-
安装 config map 和 Fluentd 作为守护程序
下载这些配置文件:
Note: If you already have Fluentd running in your cluster, please enable the nested json parser so that it can parse JSON-formatted logs from Dapr.
将配置应用到您的集群:
kubectl apply -f ./fluentd-config-map.yaml kubectl apply -f ./fluentd-dapr-with-rbac.yaml -
Ensure that Fluentd is running as a daemonset. The number of FluentD instances should be the same as the number of cluster nodes. In the example below, there is only one node in the cluster:
$ kubectl get pods -n kube-system -w
NAME                          READY   STATUS    RESTARTS   AGE
coredns-6955765f44-cxjxk      1/1     Running   0          4m41s
coredns-6955765f44-jlskv      1/1     Running   0          4m41s
etcd-m01                      1/1     Running   0          4m48s
fluentd-sdrld                 1/1     Running   0          14s
使用 JSON 格式化日志安装 Dapr
-
使用 JSON 格式化日志启用 Dapr
helm repo add dapr https://dapr.github.io/helm-charts/ helm repo update helm install dapr dapr/dapr --namespace dapr-system --set global.logAsJson=true -
在 Dapr sidecar 中启用 JSON 格式化日志
Add the
dapr.io/log-as-json: "true"annotation to your deployment yaml. 例如:apiVersion: apps/v1 kind: Deployment metadata: name: pythonapp namespace: default labels: app: python spec: replicas: 1 selector: matchLabels: app: python template: metadata: labels: app: python annotations: dapr.io/enabled: "true" dapr.io/app-id: "pythonapp" dapr.io/log-as-json: "true" ...
搜索日志
注意: Elastic Search 需要一段时间才能索引 Fluentd 发送的日志。
-
Port-forward from localhost to
svc/kibana-kibana$ kubectl port-forward svc/kibana-kibana 5601 -n dapr-monitoring Forwarding from 127.0.0.1:5601 -> 5601 Forwarding from [::1]:5601 -> 5601 Handling connection for 5601 Handling connection for 5601 -
Browse to
http://localhost:5601 -
Expand the drop-down menu and click Management → Stack Management
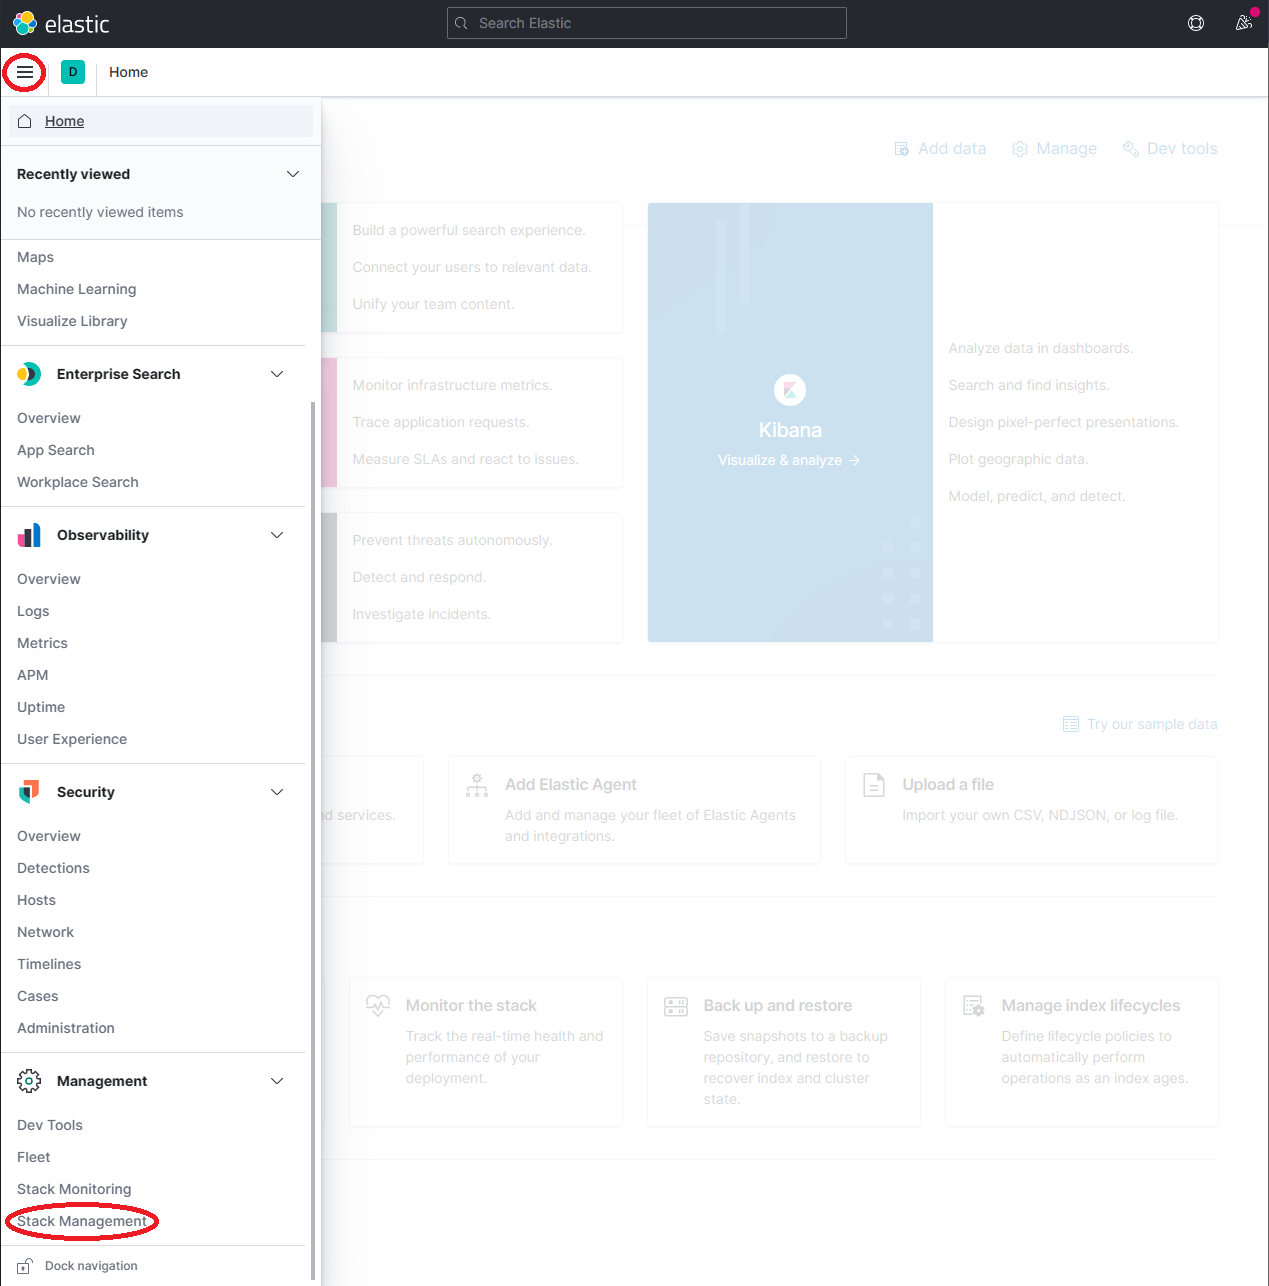
-
On the Stack Management page, select Data → Index Management and wait until
dapr-*is indexed.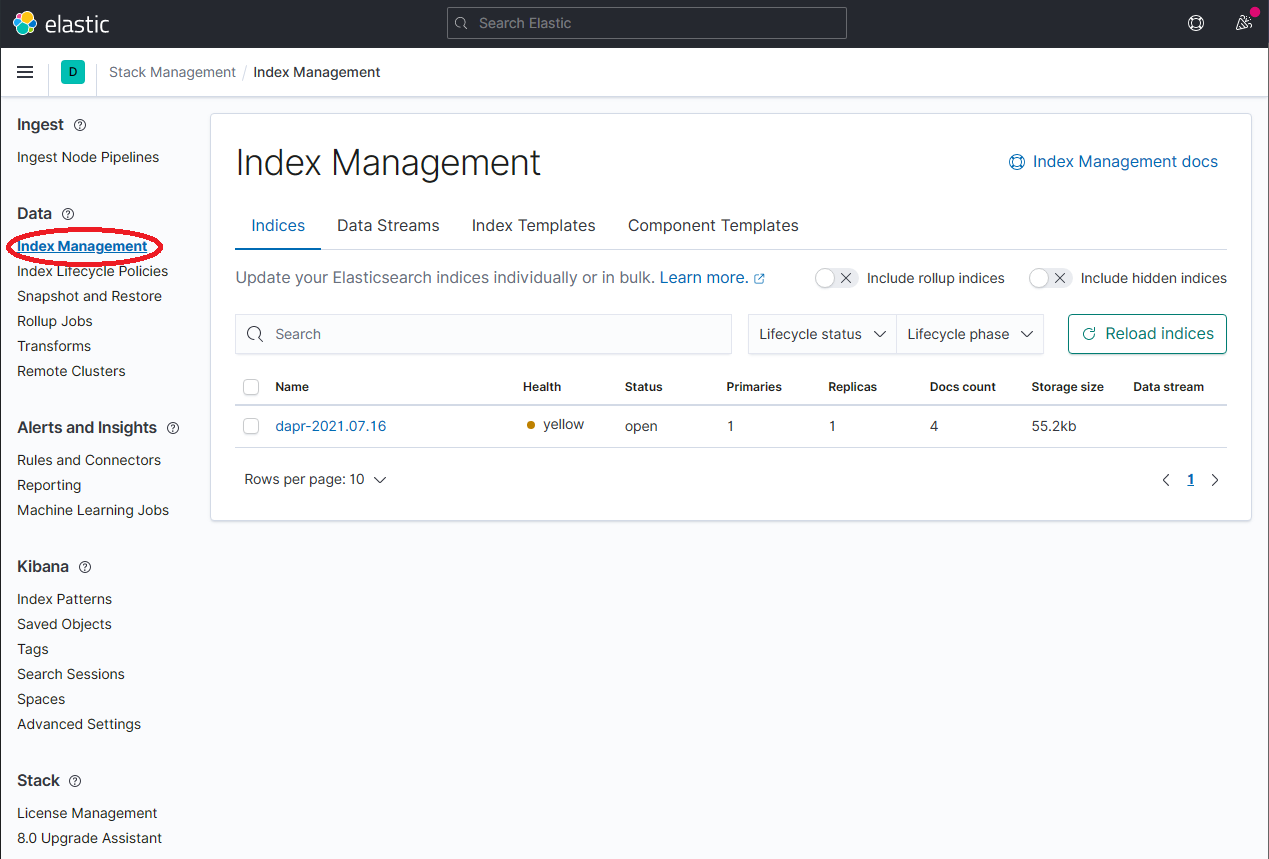
-
Once
dapr-*is indexed, click on Kibana → Index Patterns and then the Create index pattern button.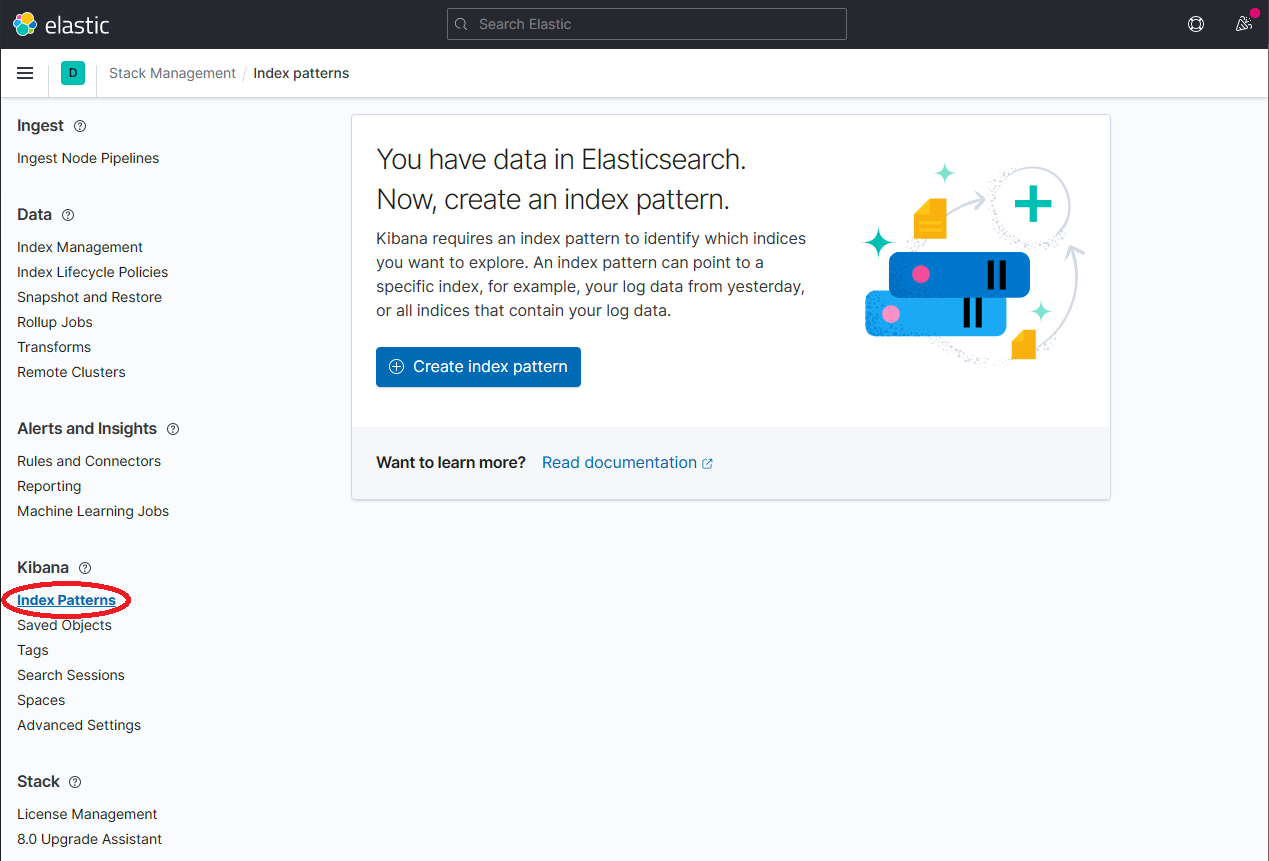
-
Define a new index pattern by typing
dapr*into the Index Pattern name field, then click the Next step button to continue.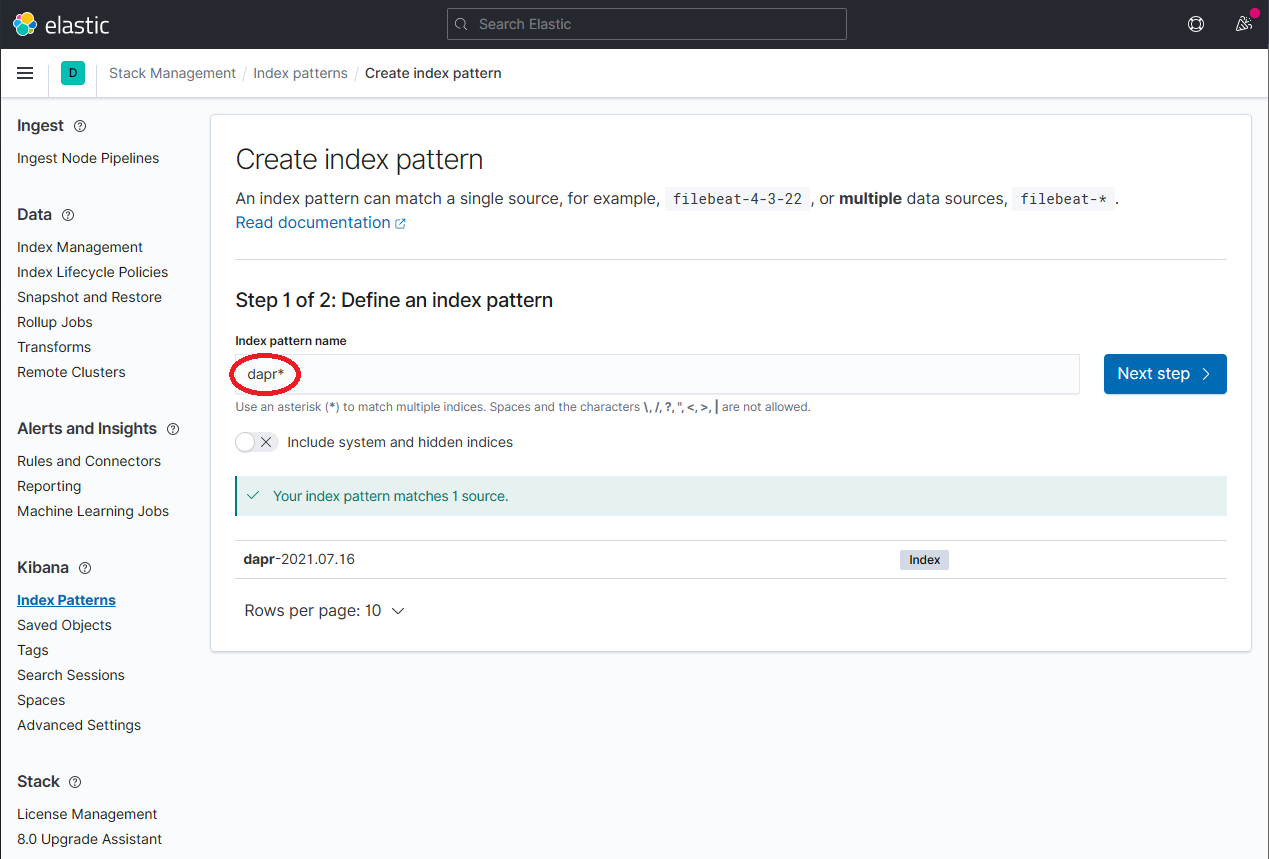
-
Configure the primary time field to use with the new index pattern by selecting the
@timestampoption from the Time field drop-down. Click the Create index pattern button to complete creation of the index pattern.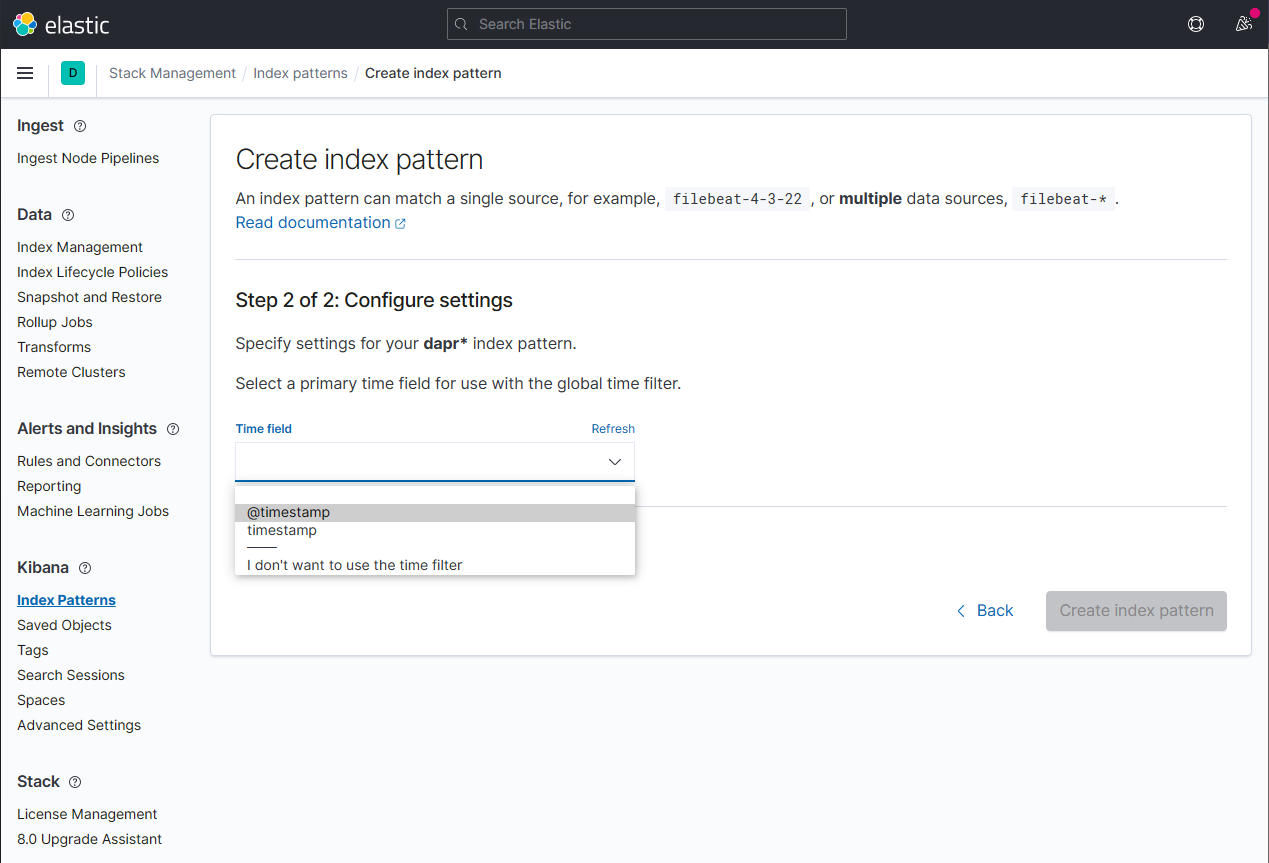
-
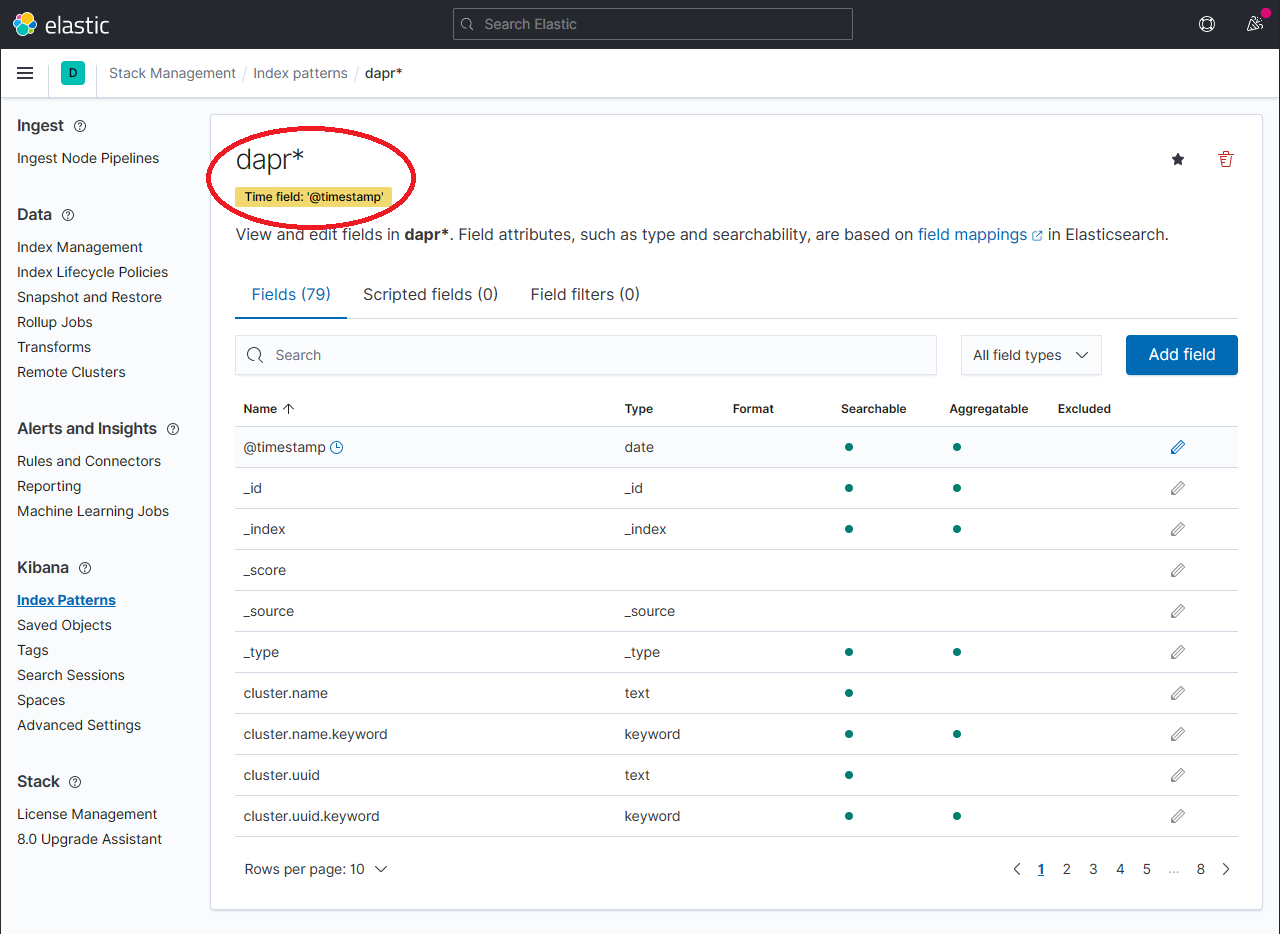
The newly created index pattern should be shown. Confirm that the fields of interest such as
scope,type,app_id,level, etc. are being indexed by using the search box in the Fields tab.Note: If you cannot find the indexed field, please wait. The time it takes to search across all indexed fields depends on the volume of data and size of the resource that the elastic search is running on.
-
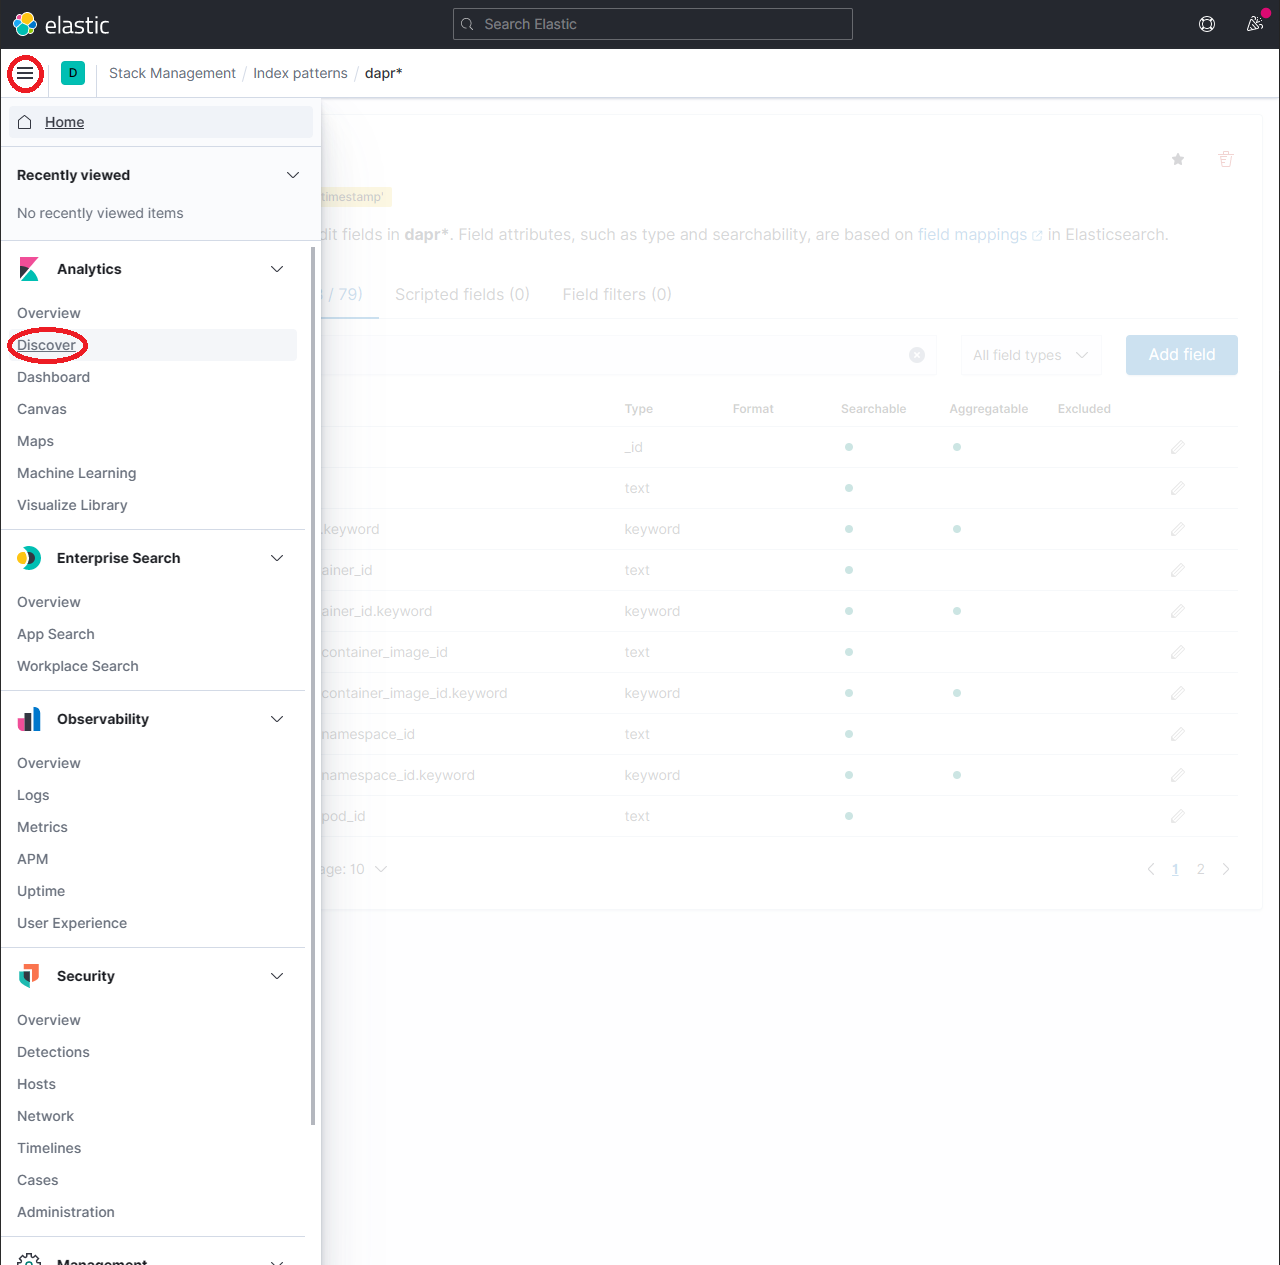
To explore the indexed data, expand the drop-down menu and click Analytics → Discover.
-
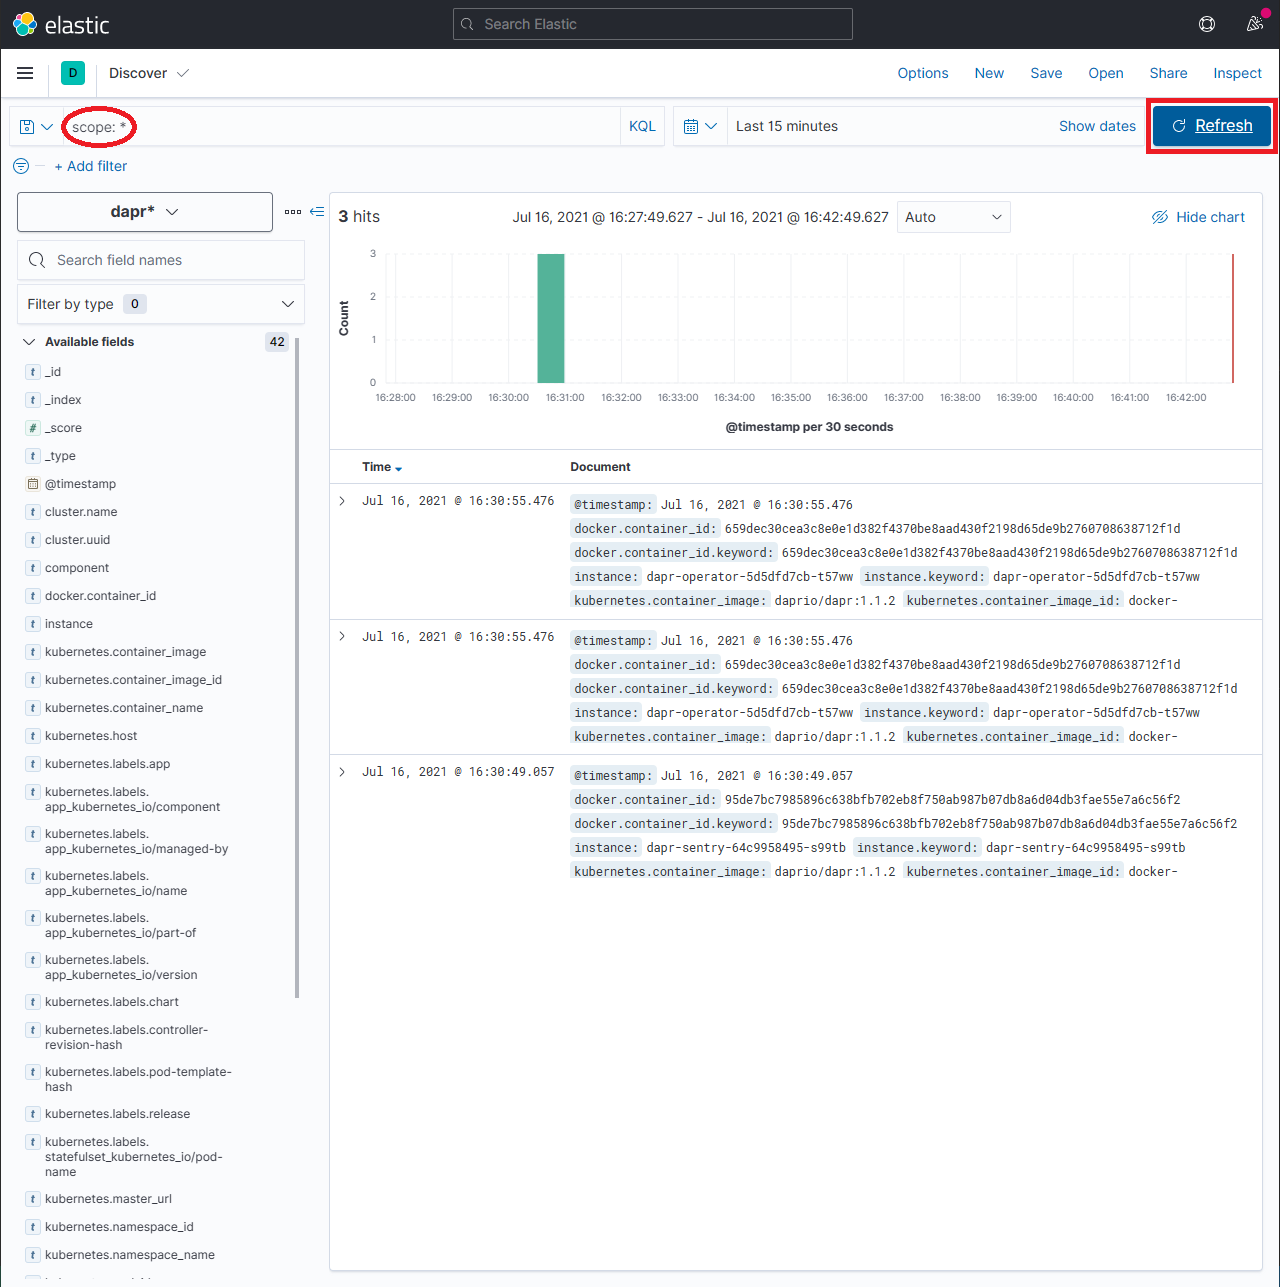
In the search box, type in a query string such as
scope:*and click the Refresh button to view the results.Note: This can take a long time. The time it takes to return all results depends on the volume of data and size of the resource that the elastic search is running on.
参考资料
Feedback
Was this page helpful?
Glad to hear it! Please tell us how we can improve.
Sorry to hear that. Please tell us how we can improve.