The documentation you are viewing is for Dapr v1.4 which is an older version of Dapr. For up-to-date documentation, see the latest version.
操作方法: 为分布式跟踪安装 Jaeger
Dapr supports the Zipkin protocol. Since Jaeger is compatible with Zipkin, the Zipkin protocol can be used to communication with Jaeger.
配置自托管模式
设置
The simplest way to start Jaeger is to use the pre-built all-in-one Jaeger image published to DockerHub:
docker run -d --name jaeger \
  -e COLLECTOR_ZIPKIN_HOST_PORT=:9412 \
  -p 16686:16686 \
  -p 9412:9412 \
  jaegertracing/all-in-one:1.22
接下来,在本地创建以下YAML文件:
- config.yaml: 注意, 因为我们正在使用 Zipkin 协议 来与 Jaeger 通信, 我们指定
zipkin追踪部分 配置设置endpointAddress来定位Jaeger 实例。
apiVersion: dapr.io/v1alpha1
kind: Configuration
metadata:
  name: tracing
  namespace: default
spec:
  tracing:
    samplingRate: "1"
    zipkin:
      endpointAddress: "http://localhost:9412/api/v2/spans"
要启动指向新的 YAML 文件的应用程序,您可以使用 --config 选项:
dapr run --app-id mynode --app-port 3000 node app.js --config config.yaml
查看 Traces
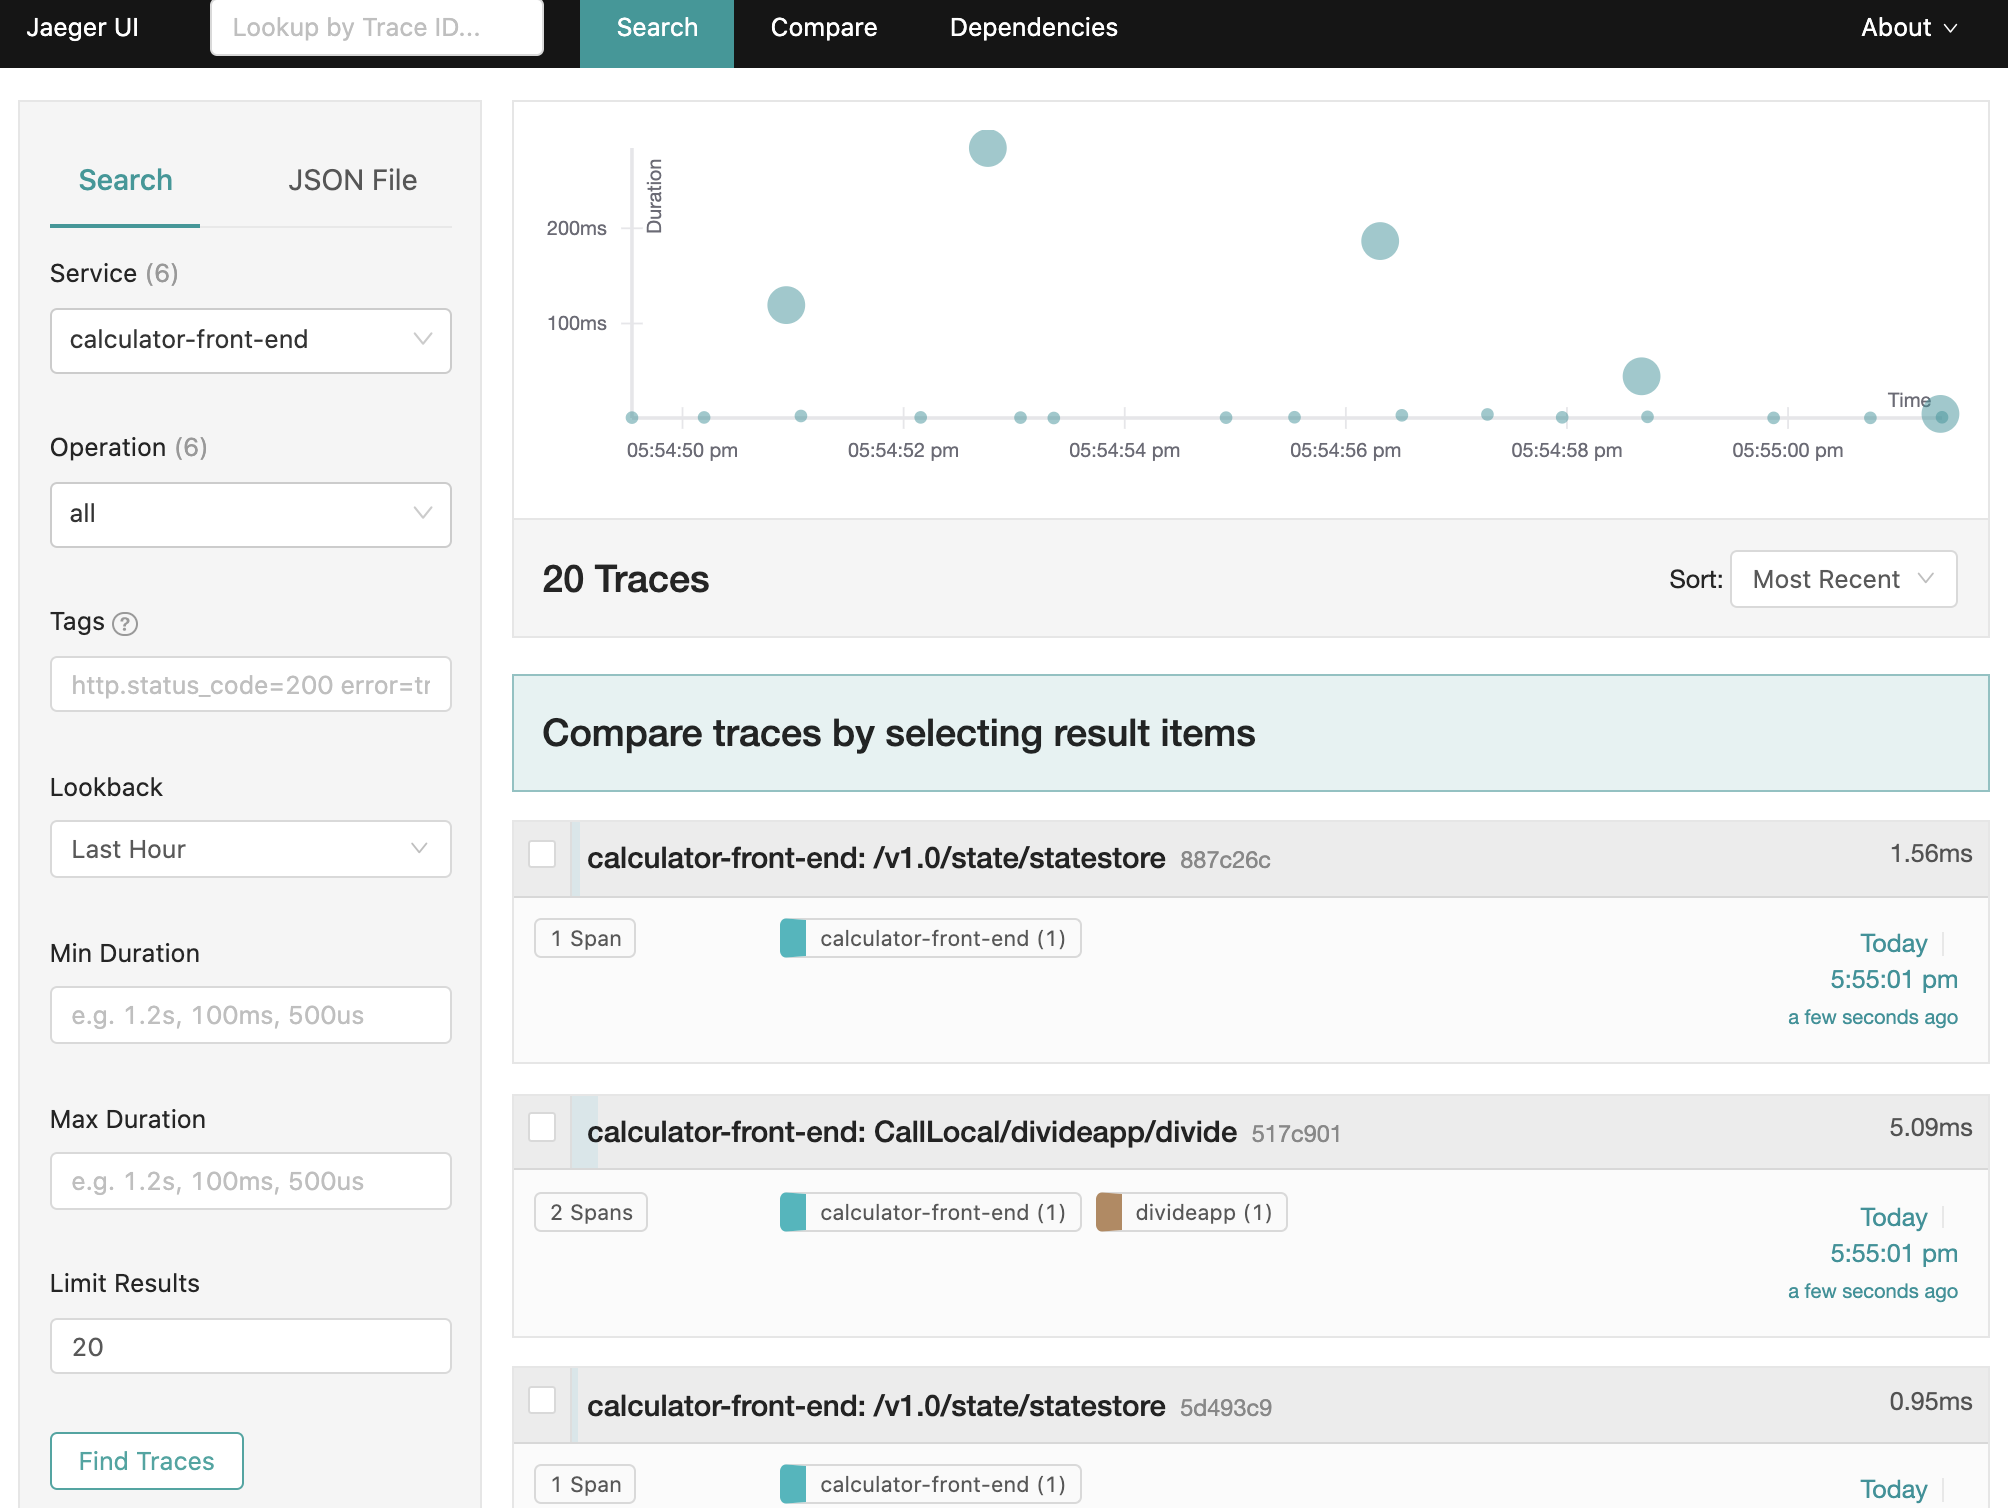
To view traces, in your browser go to http://localhost:16686 to see the Jaeger UI.
配置 Kubernetes
以下步骤可向您展示如何配置 Dapr 将分布式跟踪数据发送给 Jaeger,该数据作为 Dapr 中的容器运行,以及如何查看它们。
设置
First create the following YAML file to install Jaeger, file name is jaeger-operator.yaml
Development and test
By default, the allInOne Jaeger image uses memory as the backend storage and it is not recommended to use this in a production environment.
apiVersion: jaegertracing.io/v1
kind: "Jaeger"
metadata:
  name: jaeger
spec:
  strategy: allInOne
  ingress:
    enabled: false
  allInOne:
    image: jaegertracing/all-in-one:1.22
    options:
      query:
        base-path: /jaeger
Production
Jaeger uses Elasticsearch as the backend storage, and you can create a secret in k8s cluster to access Elasticsearch server with access control. See Configuring and Deploying Jaeger
kubectl create secret generic jaeger-secret --from-literal=ES_PASSWORD='xxx' --from-literal=ES_USERNAME='xxx' -n ${NAMESPACE}
apiVersion: jaegertracing.io/v1
kind: "Jaeger"
metadata:
  name: jaeger
spec:
  strategy: production
  query:
    options:
      log-level: info
      query:
        base-path: /jaeger
  collector:
    maxReplicas: 5
    resources:
      limits:
        cpu: 500m
        memory: 516Mi
  storage:
    type: elasticsearch
    esIndexCleaner:
      enabled: false                                ## turn the job deployment on and off
      numberOfDays: 7                               ## number of days to wait before deleting a record
      schedule: "55 23 * * *"                       ## cron expression for it to run
      image: jaegertracing/jaeger-es-index-cleaner  ## image of the job
    secretName: jaeger-secret
    options:
      es:
        server-urls: http://elasticsearch:9200
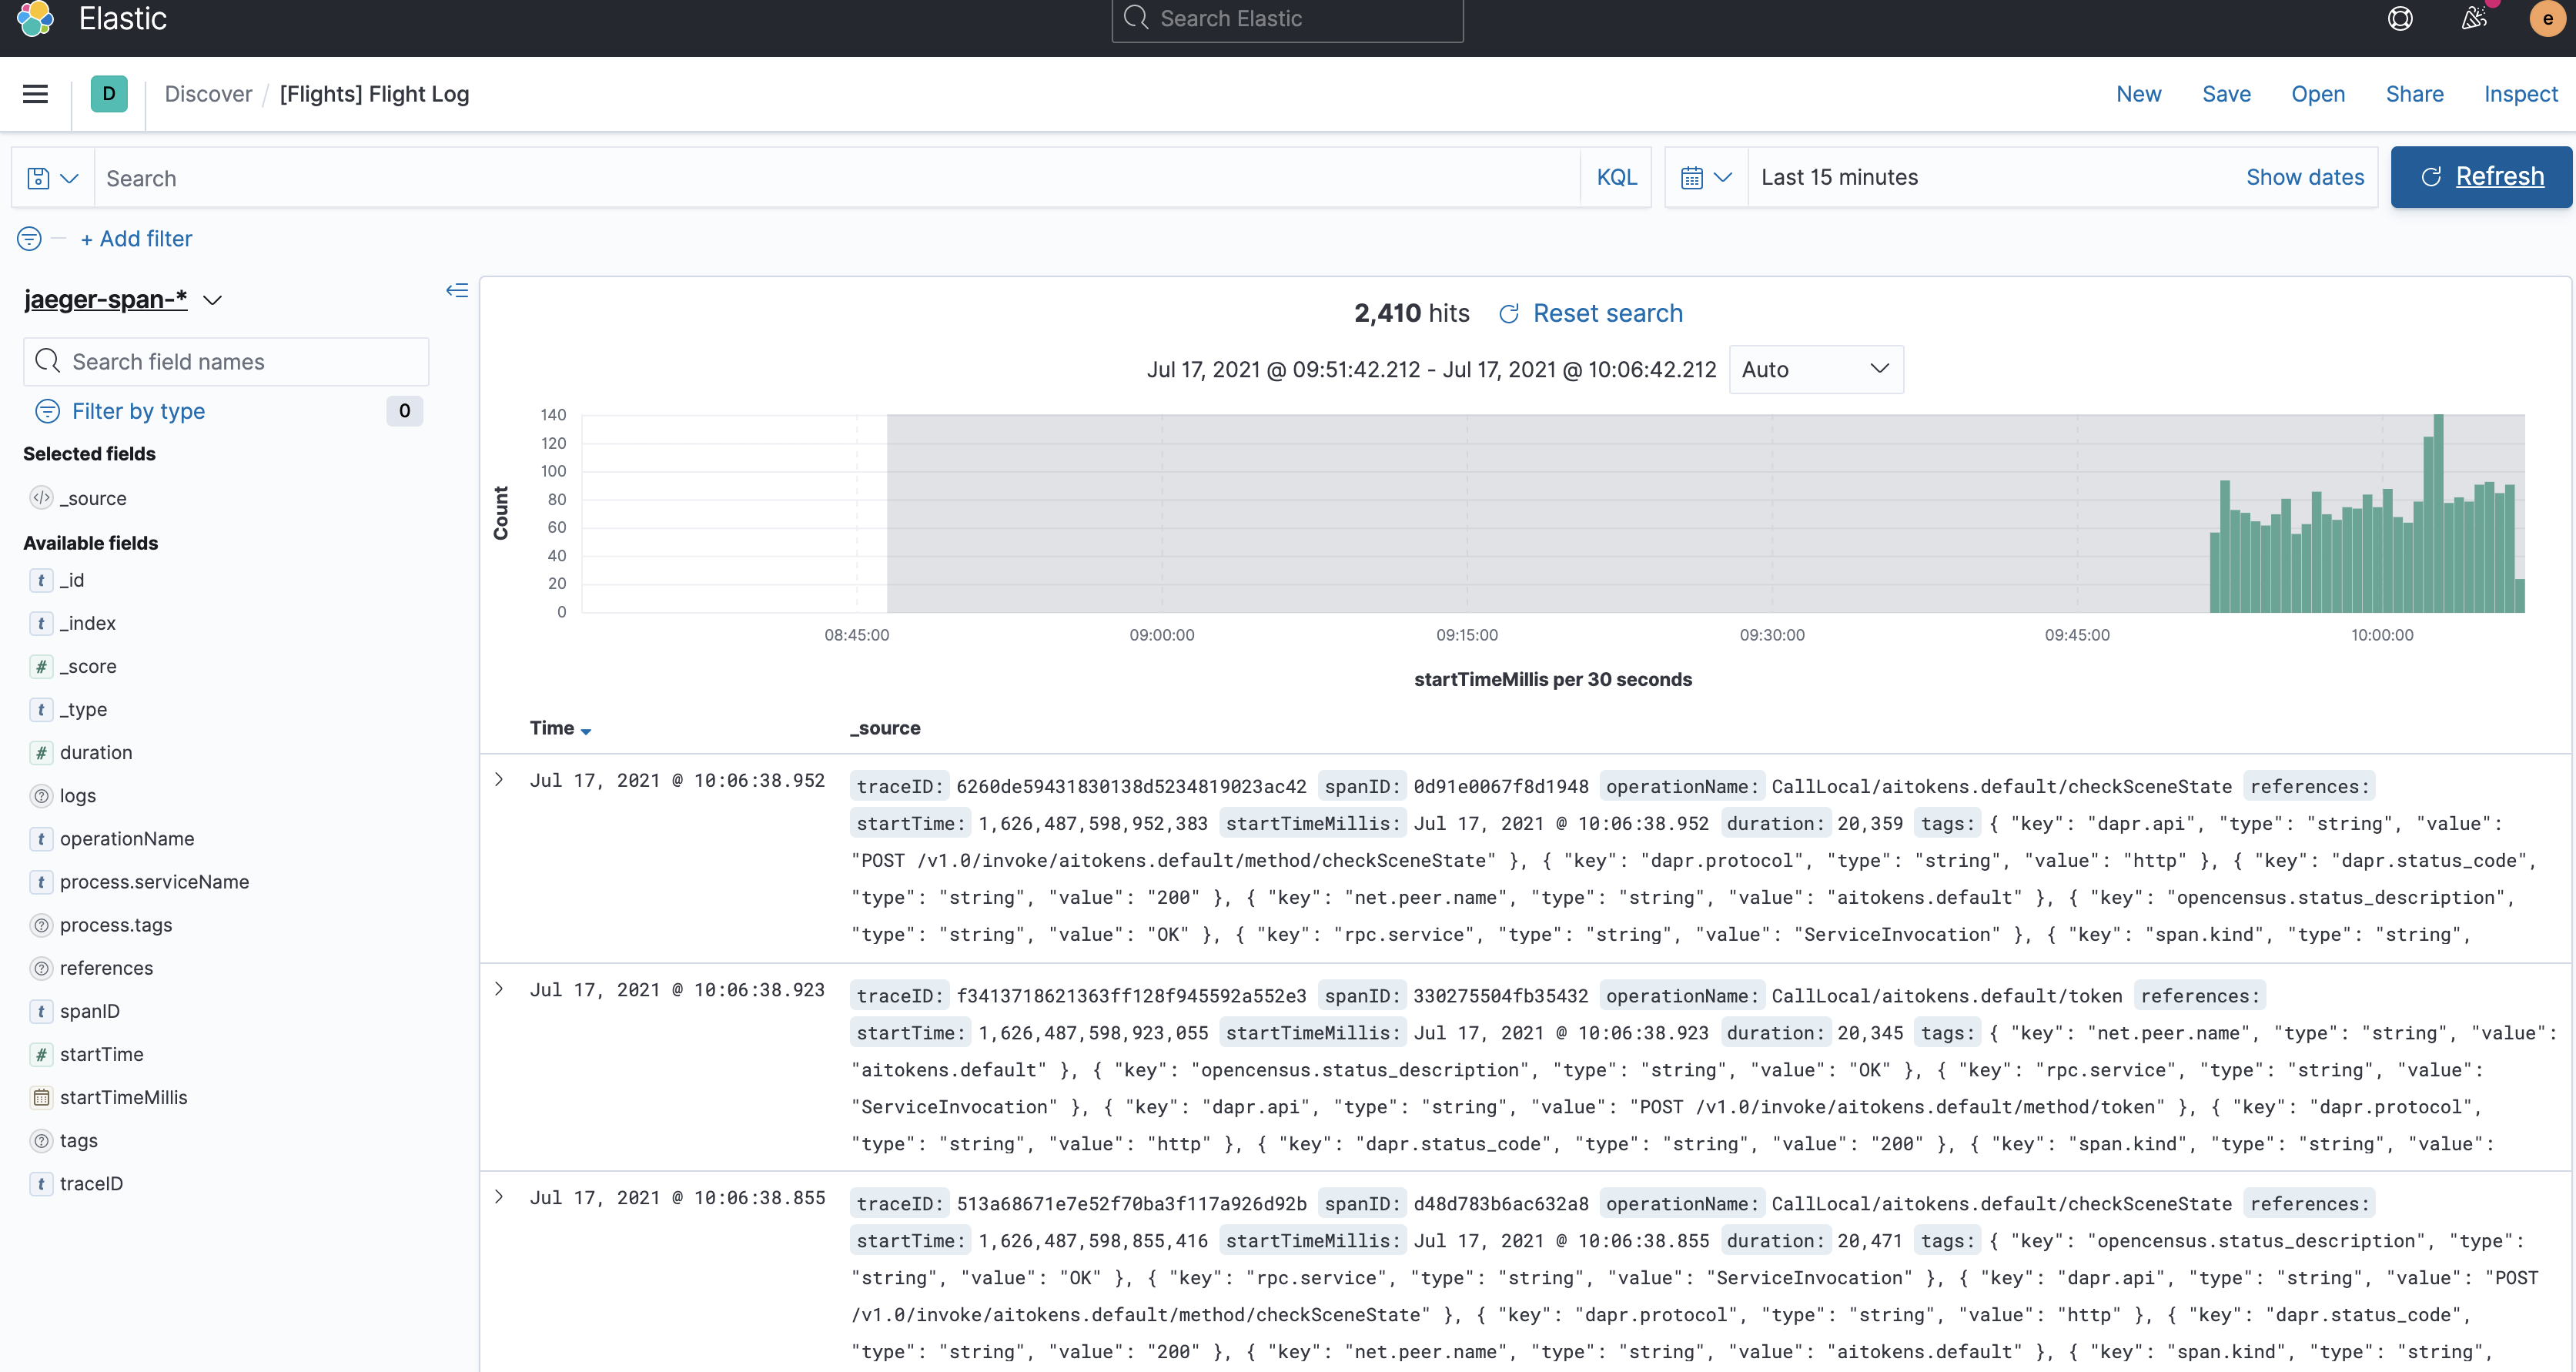
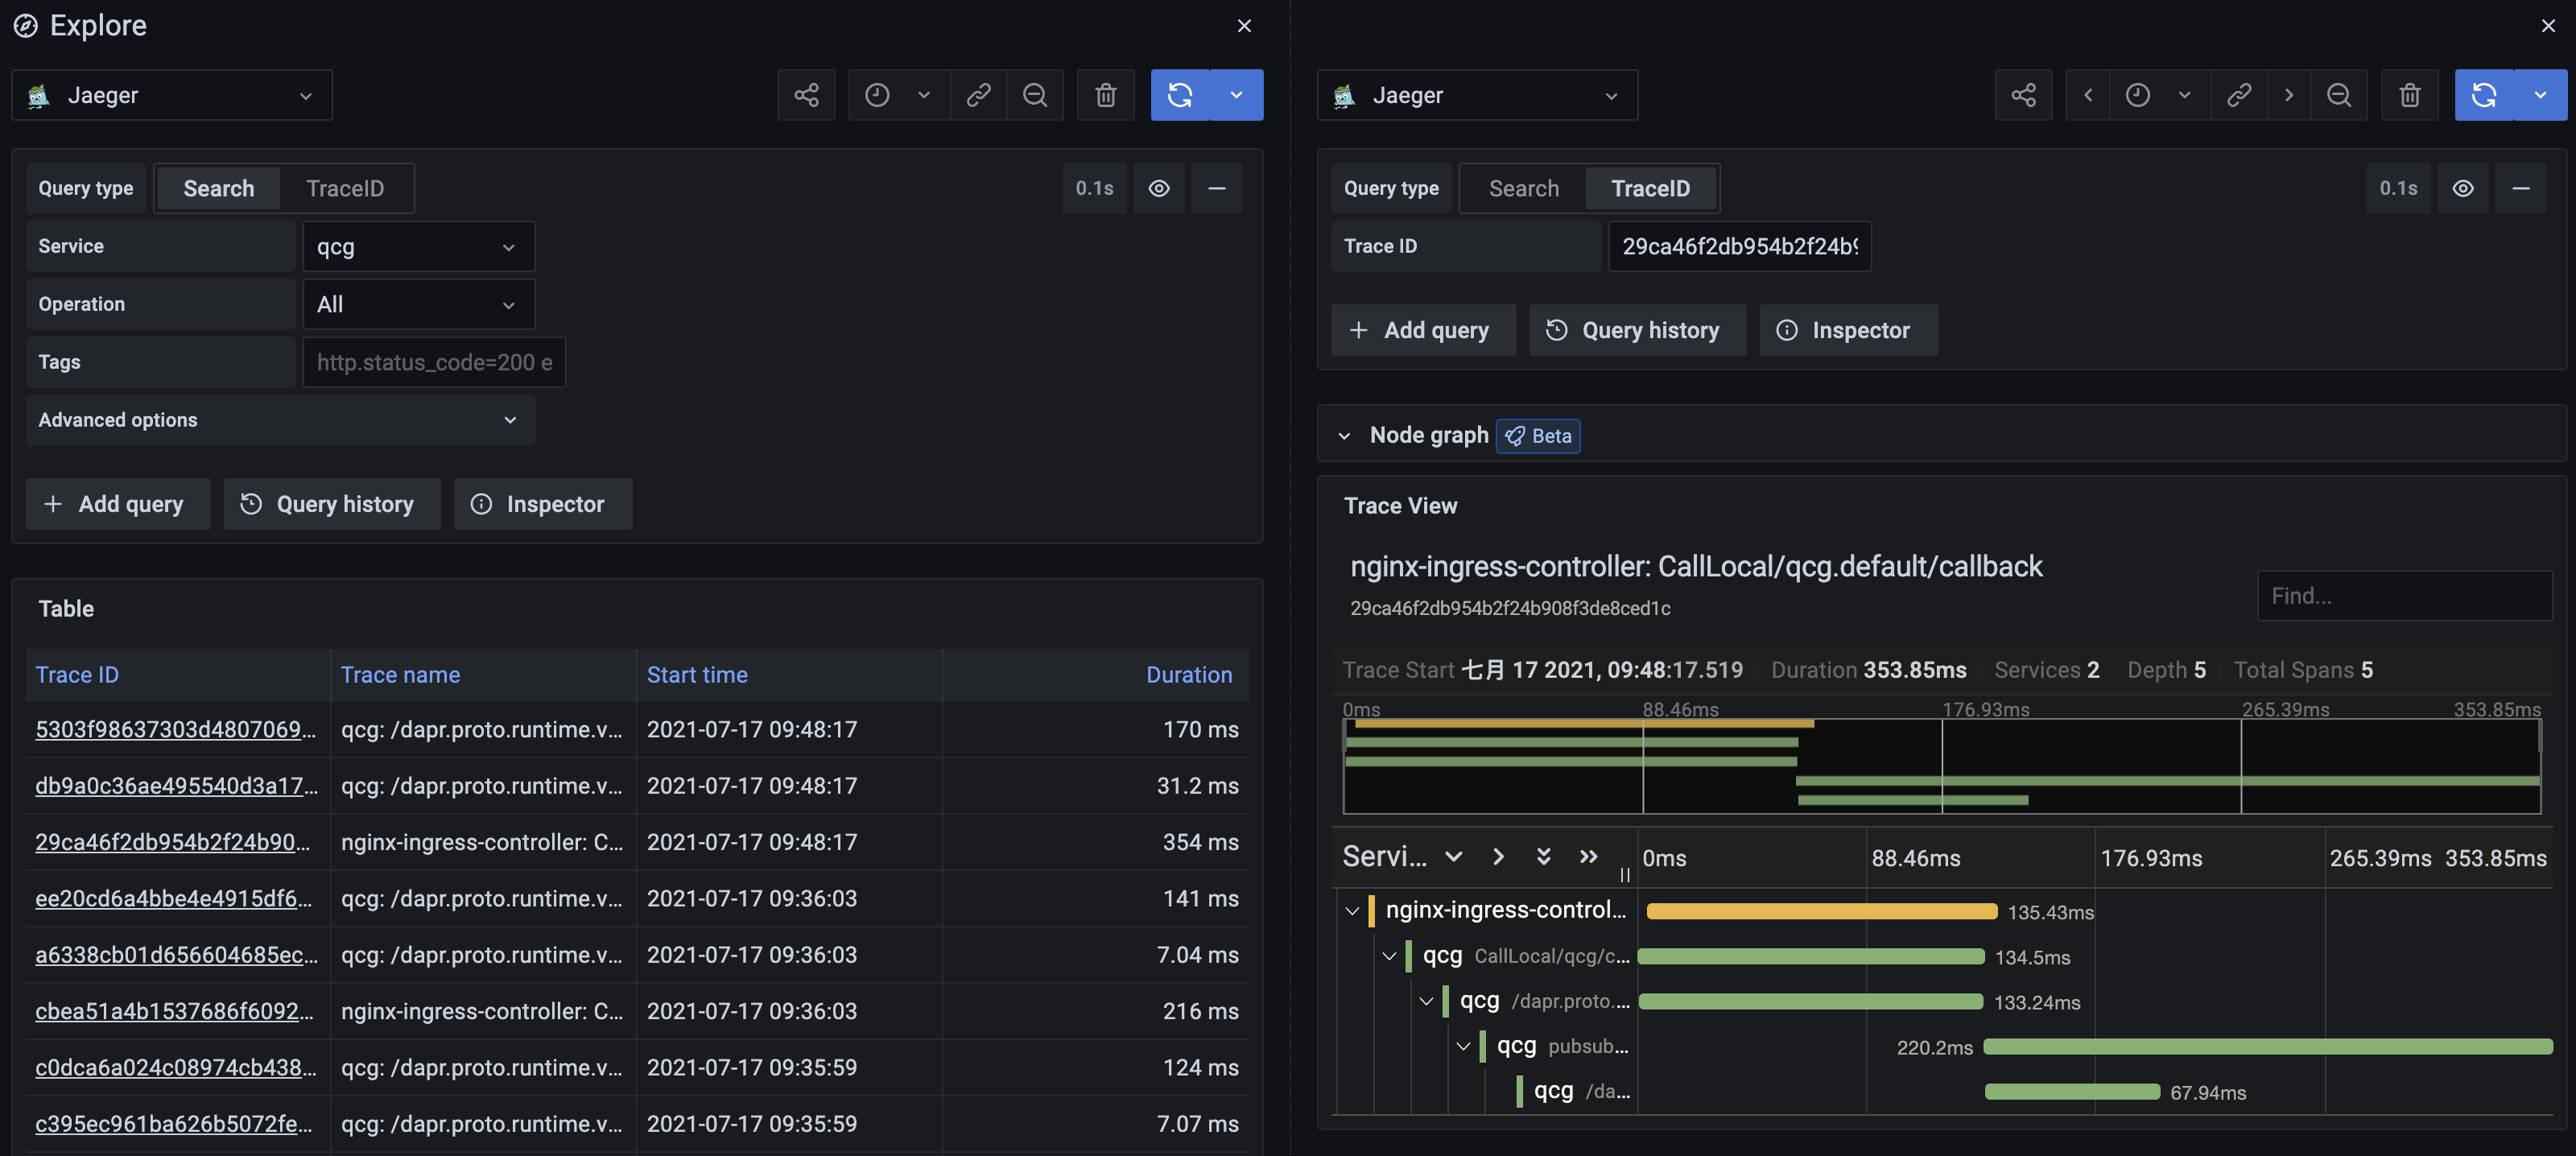
The pictures are as follows, include Elasticsearch and Grafana tracing data:
现在,使用上面的 YAML 文件安装 Jaeger
# Install Jaeger
helm repo add jaegertracing https://jaegertracing.github.io/helm-charts
helm install jaeger-operator jaegertracing/jaeger-operator
kubectl apply -f jaeger-operator.yaml

# Wait for Jaeger to be up and running
kubectl wait deploy --selector app.kubernetes.io/name=jaeger --for=condition=available
接下来,在本地创建以下YAML文件:
- tracing.yaml
apiVersion: dapr.io/v1alpha1
kind: Configuration
metadata:
  name: tracing
  namespace: default
spec:
  tracing:
    samplingRate: "1"
    zipkin:
      endpointAddress: "http://jaeger-collector.default.svc.cluster.local:9411/api/v2/spans"
最后,部署Dapr组件和配置文件:
kubectl apply -f tracing.yaml
为了启用您的 Dapr sidecar 的配置,请在您的pod spec模板中添加以下注释:
annotations:
  dapr.io/config: "tracing"
就这么简单! 您的 Dapr sidecar 现已配置为Jaeger使用。
查看追踪数据
要查看 traces 数据,请连接到Jaeger服务并打开 UI:
kubectl port-forward svc/jaeger-query 16686
在您的浏览器中,转到 http://localhost:16686 并会看到Jaeger UI。
参考资料
Feedback
Was this page helpful?
Glad to hear it! Please tell us how we can improve.
Sorry to hear that. Please tell us how we can improve.